Interview Take-Home — 72 Hours
Nordic Semiconductor: Bridging the "Empty State" Trust Gap
Designing trust and clarity into a scooter-fleet management platform's day-one empty state.
ContextData Heavy, B2B
Hypothetical Product Context
Mobility solution management platform focusing on scooter rental companies to track scooters in real time and also, understand business performance.
01Problem Statement
Days of Empty Dashboard
Provisioning delays time-to-value and causes users to abandon the product.
New users see an empty dashboard for days because scooter provisioning requires multiple technician-driven steps.
This delays time-to-value and causes users to abandon the product.
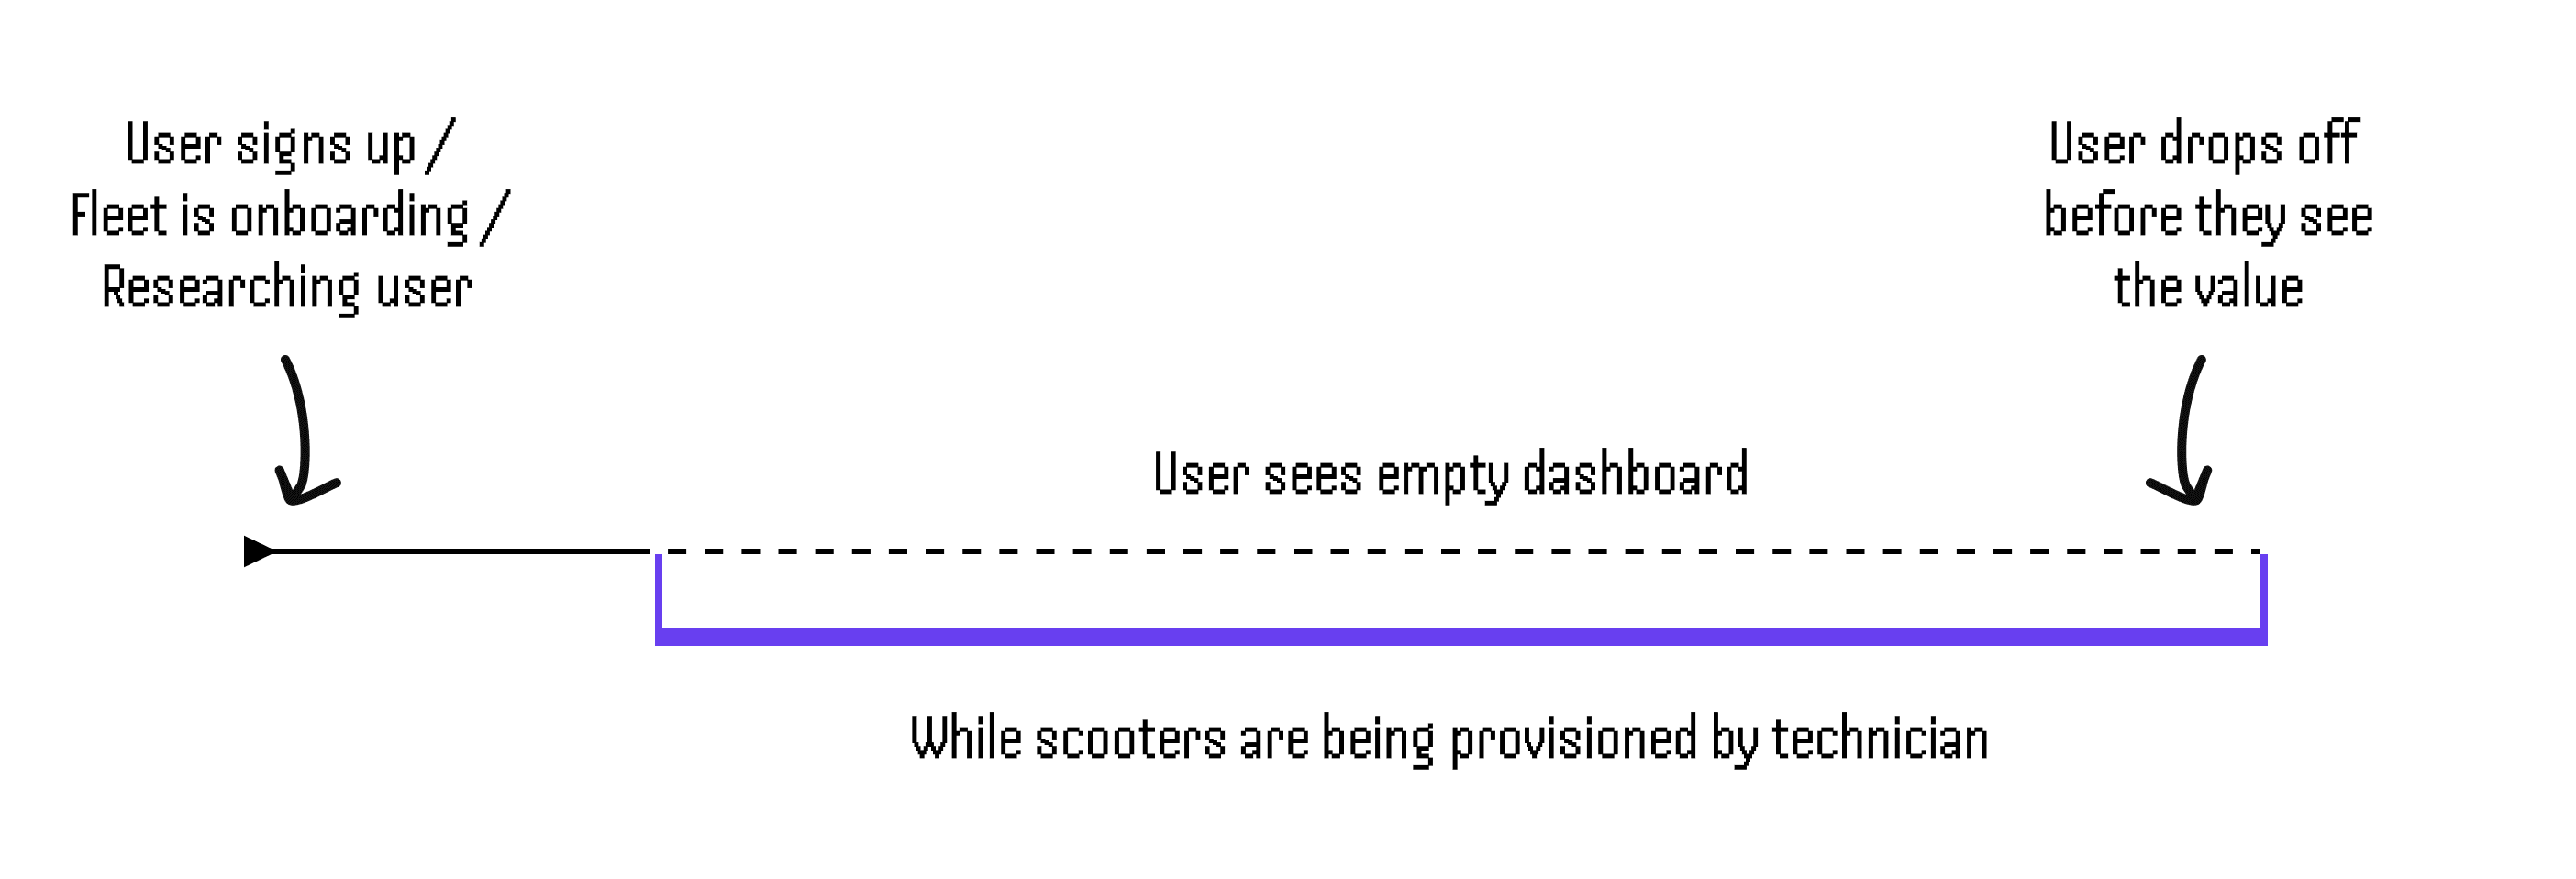
Fig: The Issue
02Questions
Scope Sharpening Questions
To solve for scalability and long-term utility, I audited the operational bottlenecks that usually break IoT dashboards.
Operational Velocity
What is the typical technician timeline? Setting these expectations reduces user uncertainty.
System Scalability
How does the internal registry handle scooters added over time without duplicate setups?
Role-Based Logic
Who handles repairs — Admin, Mechanic, or Technician? This defines the notification flows and visibility layers.
Process Bottlenecks
Does the platform need to support insurance approval chains before a scooter appears live?
03Submission Requirements
What Was Asked
Describe your proposed directions. Outline an MVP (that can be put together in 1-2 months), explain what you would prioritize and leave out of the MVP.
04Process
Design Process & Research
I bypassed standard "onboarding tours" to see how world-class technical platforms handle the "cold start" problem.
- Competitive Benchmarking: Analyzed Joyride and ScootAPI; found they focus on features but require lengthy hardware setup before users see value.
- Empty-State Architecture: Modeled the solution after Stripe's "Test Mode" and AWS's pre-filled dashboards, allowing users to simulate high-stakes transactions and usage without real-world risk.
- Intent-Based Pathing: Designed 2 distinct entry points — one for users ready to connect their fleet and one for those who need to explore the product first.

Fig: Dashboard — focusing on business and fleet management overview
05Provisioning Tracker
Provisioning Status Tracker
A nice-to-have aimed at reducing uncertainty during onboarding.
To bridge the "empty state" gap, I proposed a Provisioning Status Tracker designed to reduce user uncertainty during the technician-driven onboarding period. By providing a granular view of the remaining technical steps, the feature gives users assurance on exactly what needs to happen before their live fleet data appears.
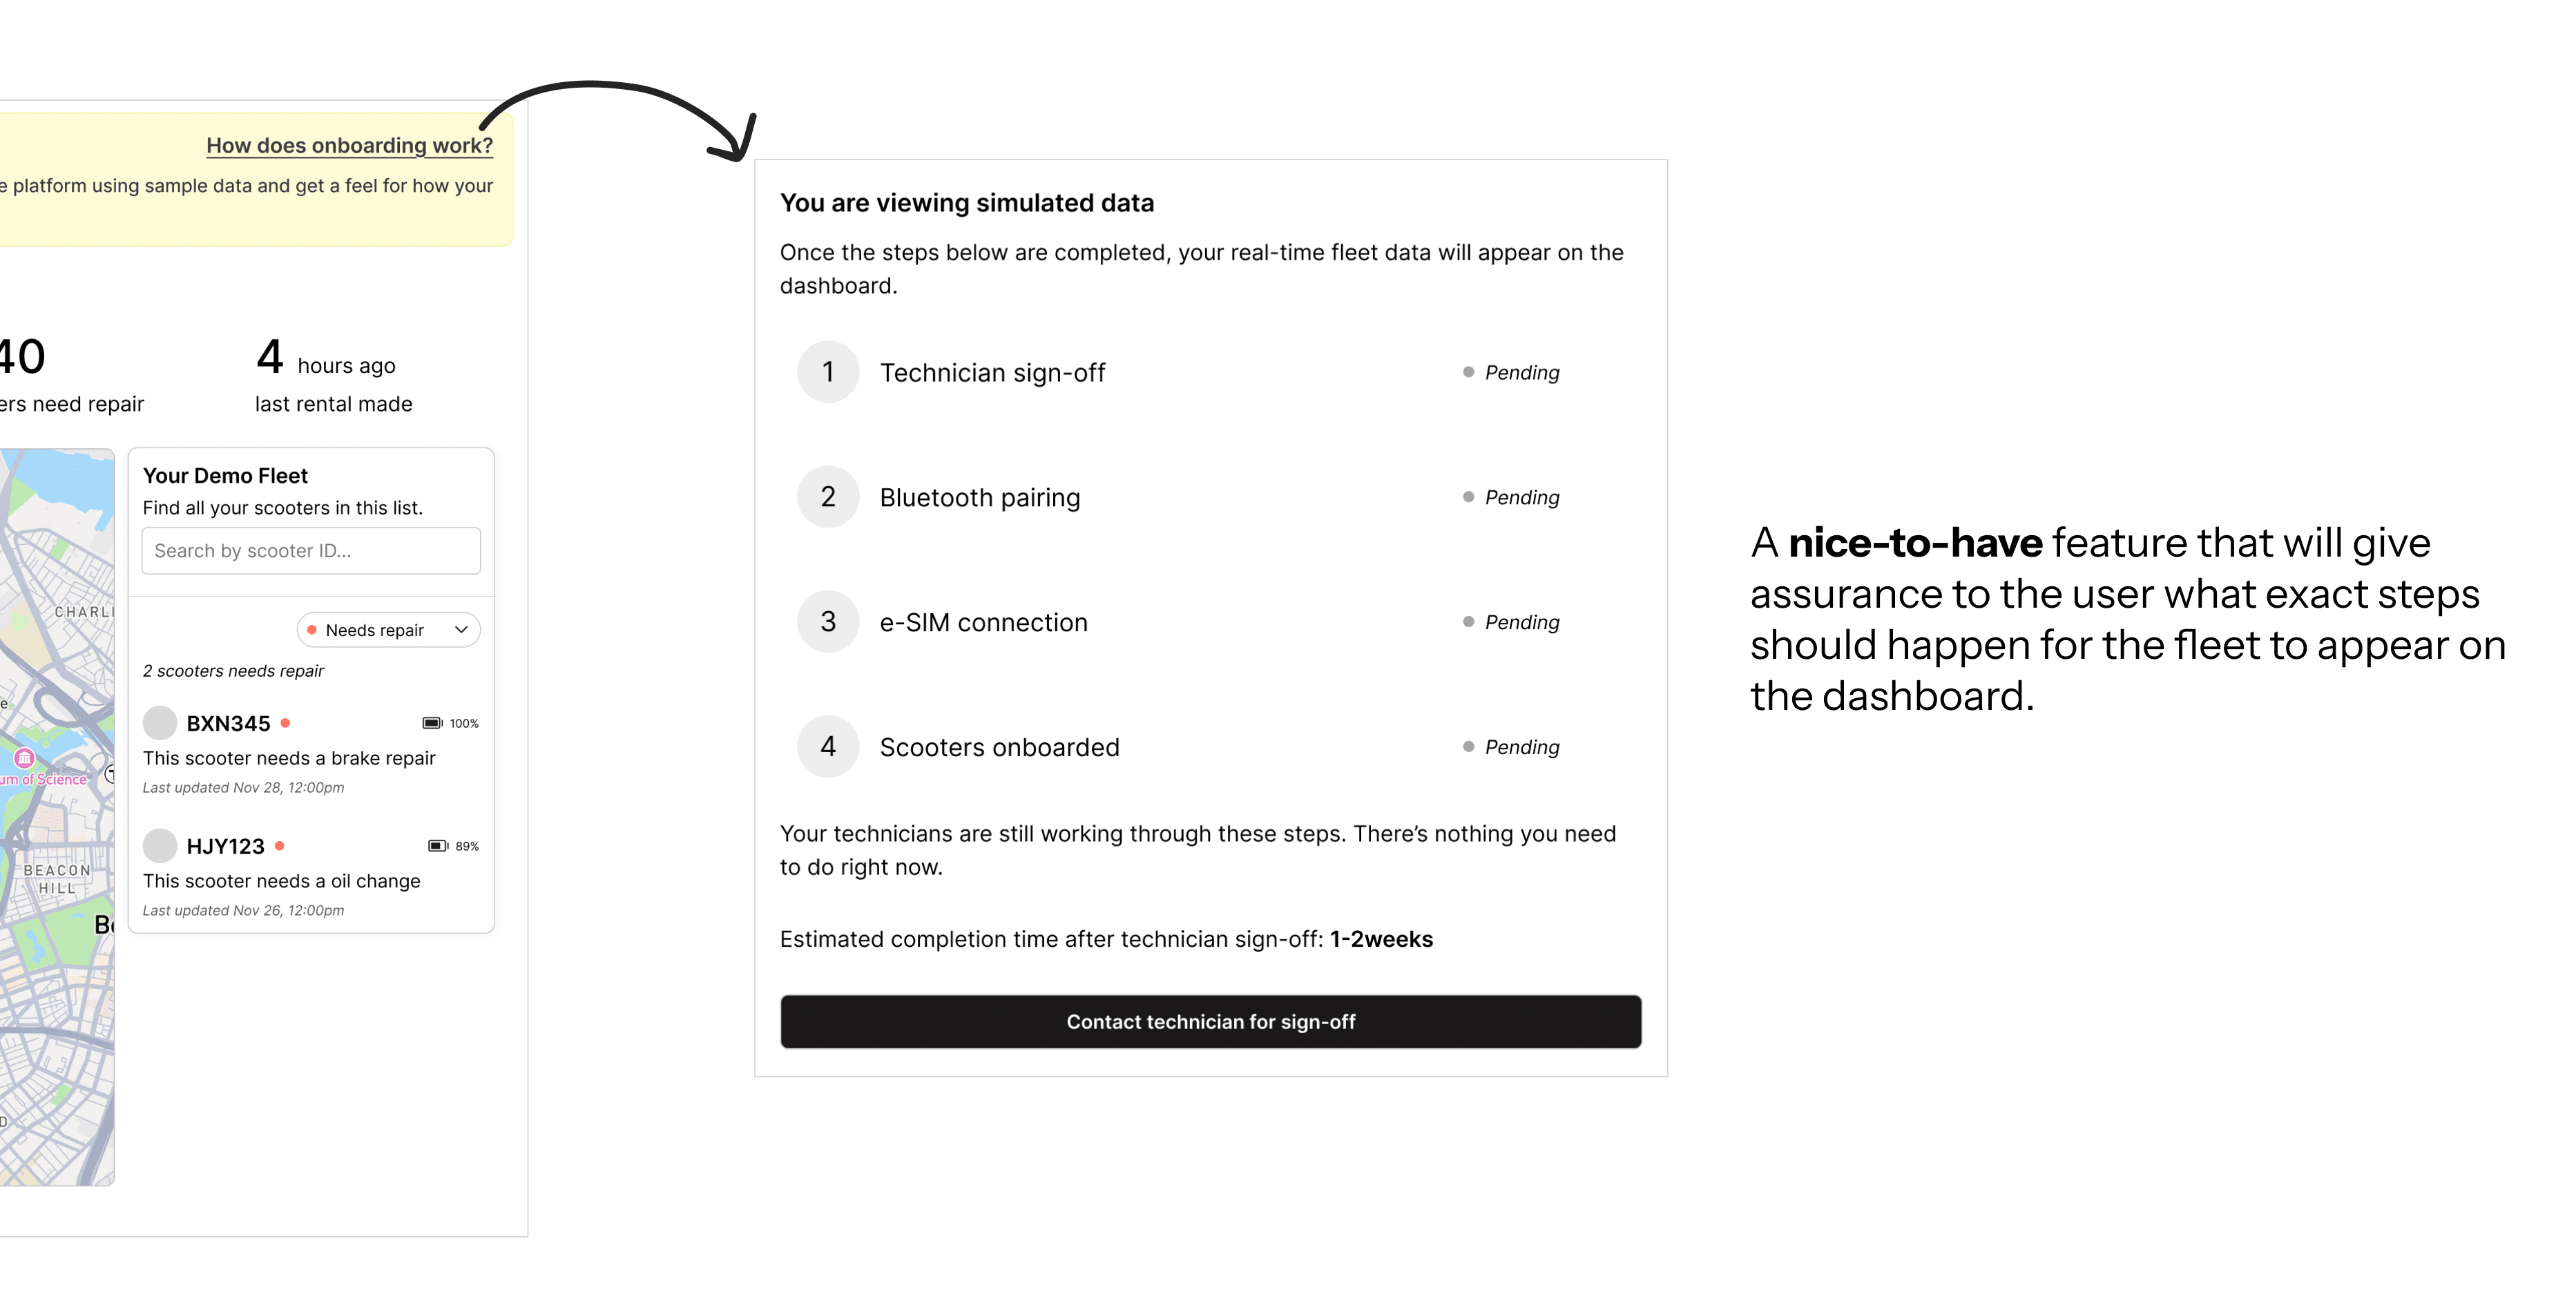
Fig: Aimed at reducing uncertainty for the users
06Revenue Management
The Core Focus
Not just showing numbers, but giving insight into the business.
- Am I making or bleeding money?
- What is my scooter utilization rate?
- How can I reduce my operational spending?
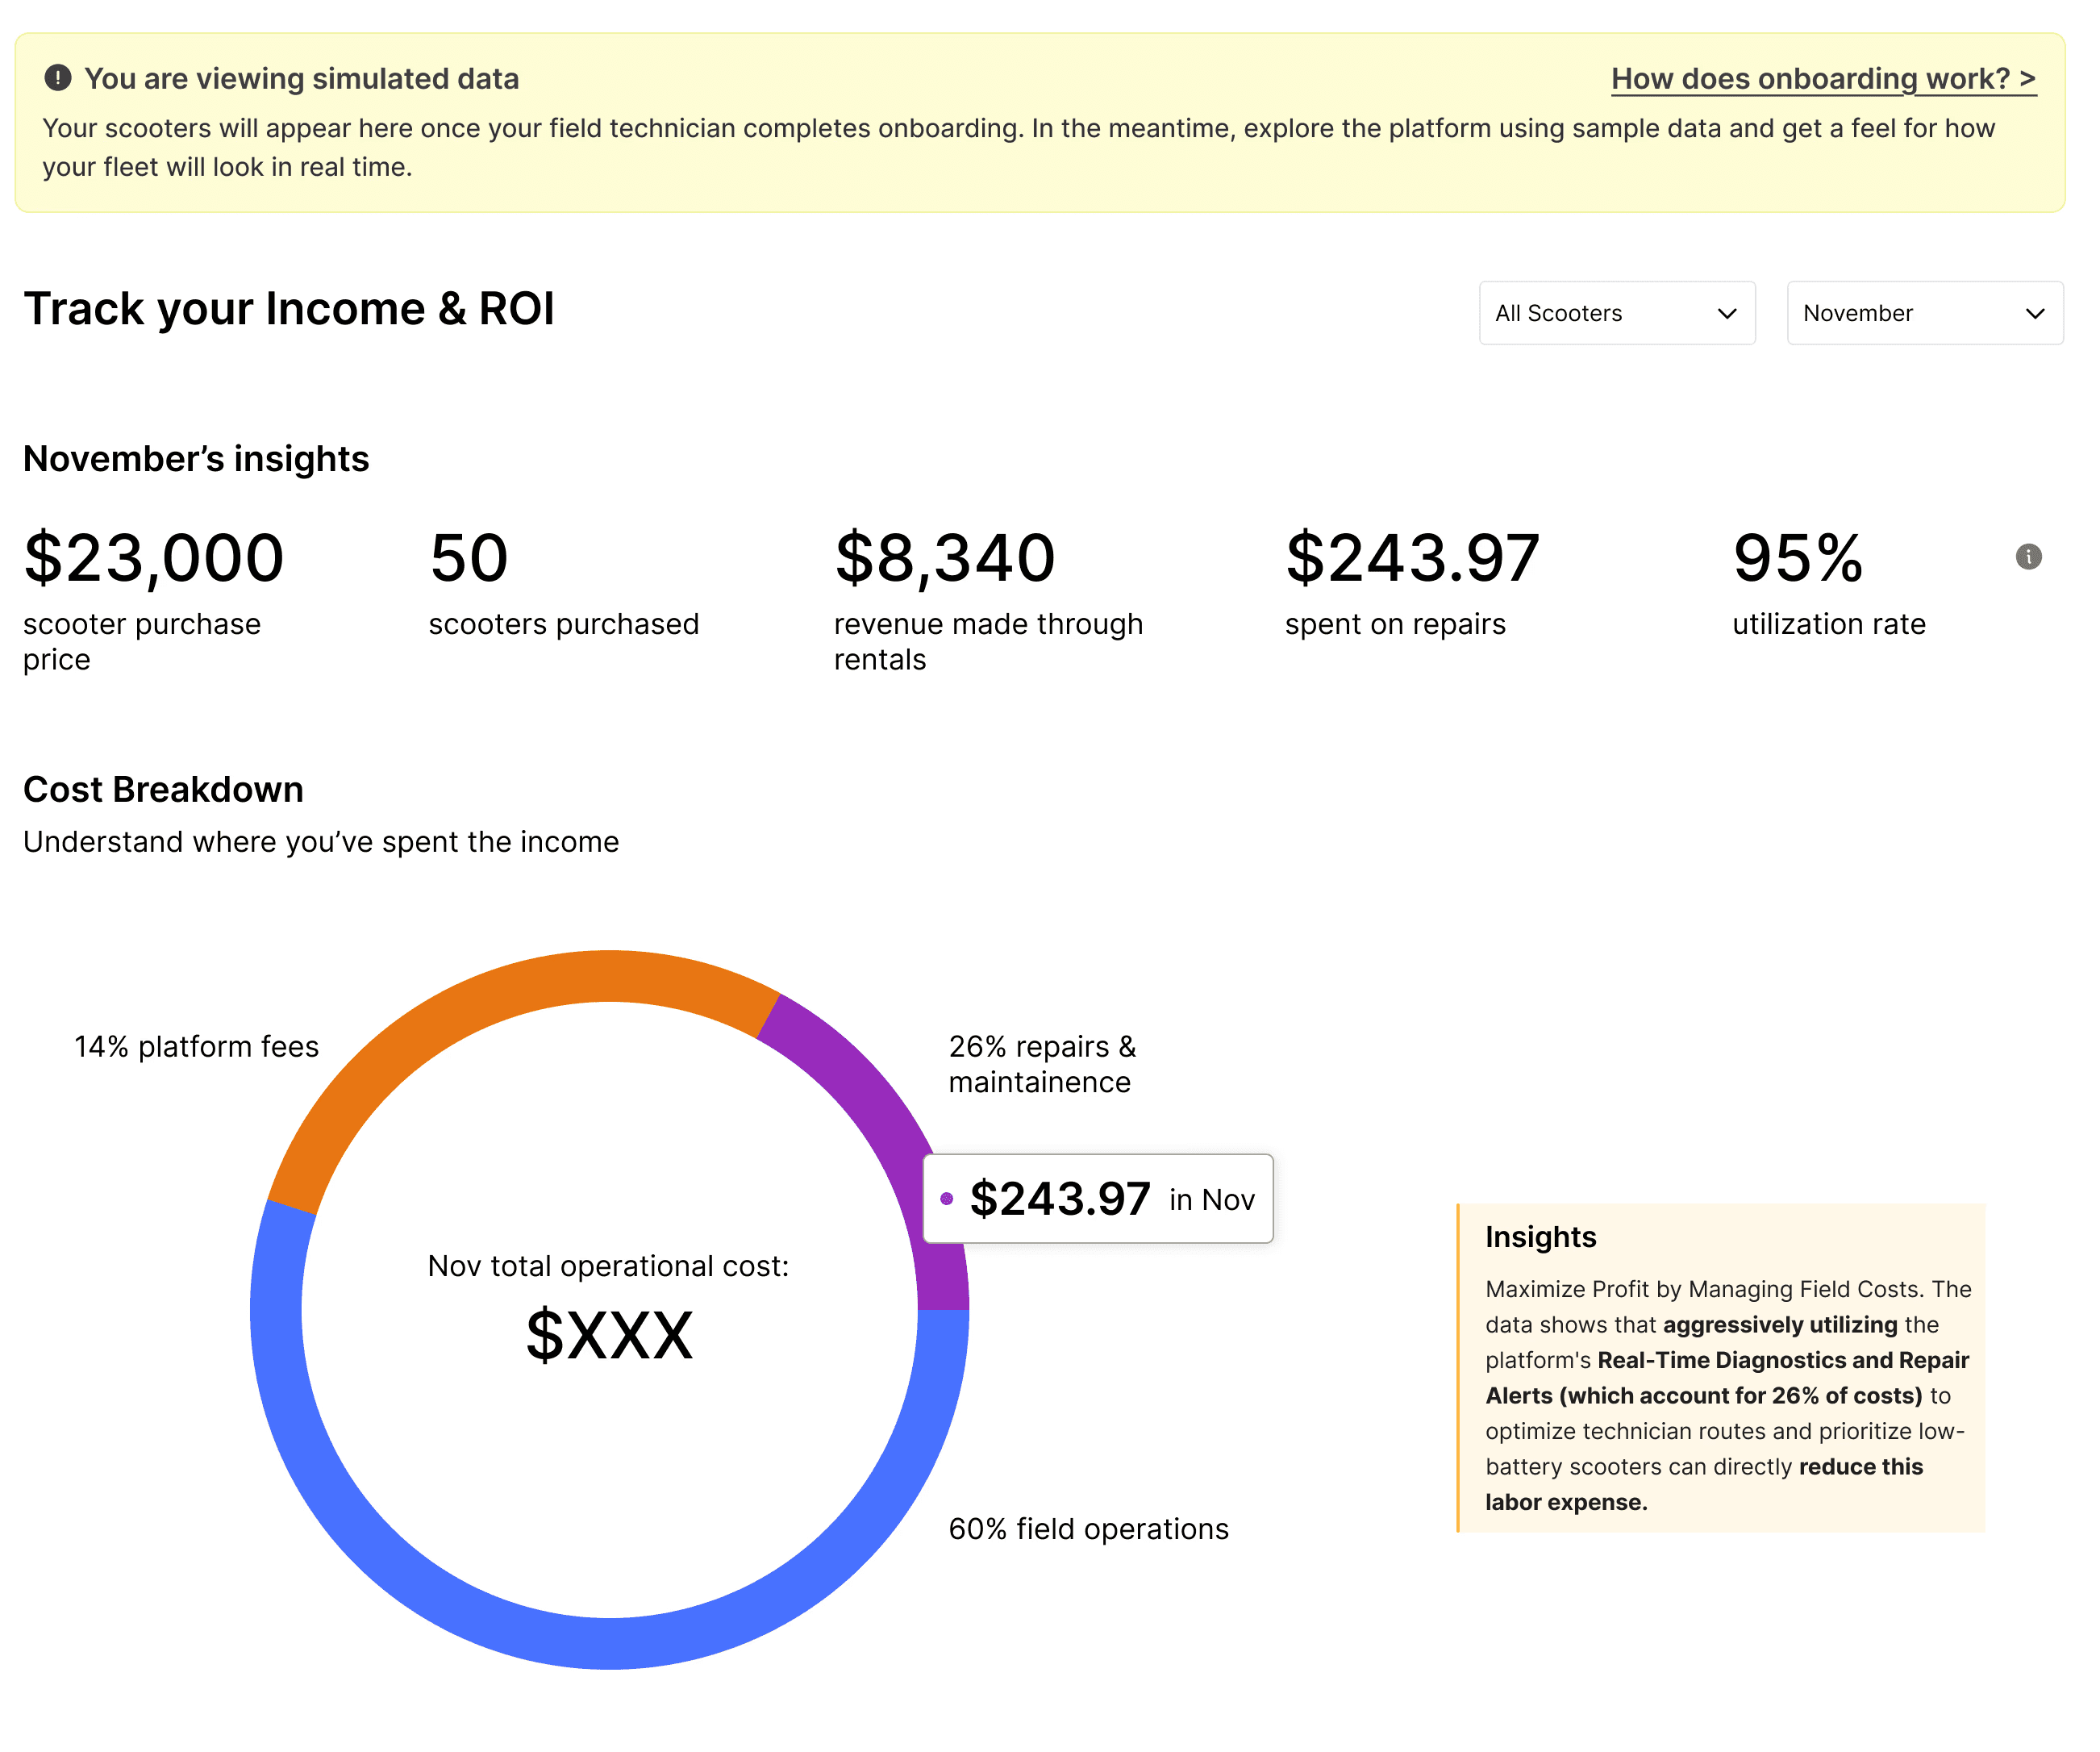
Fig: Revenue page 1
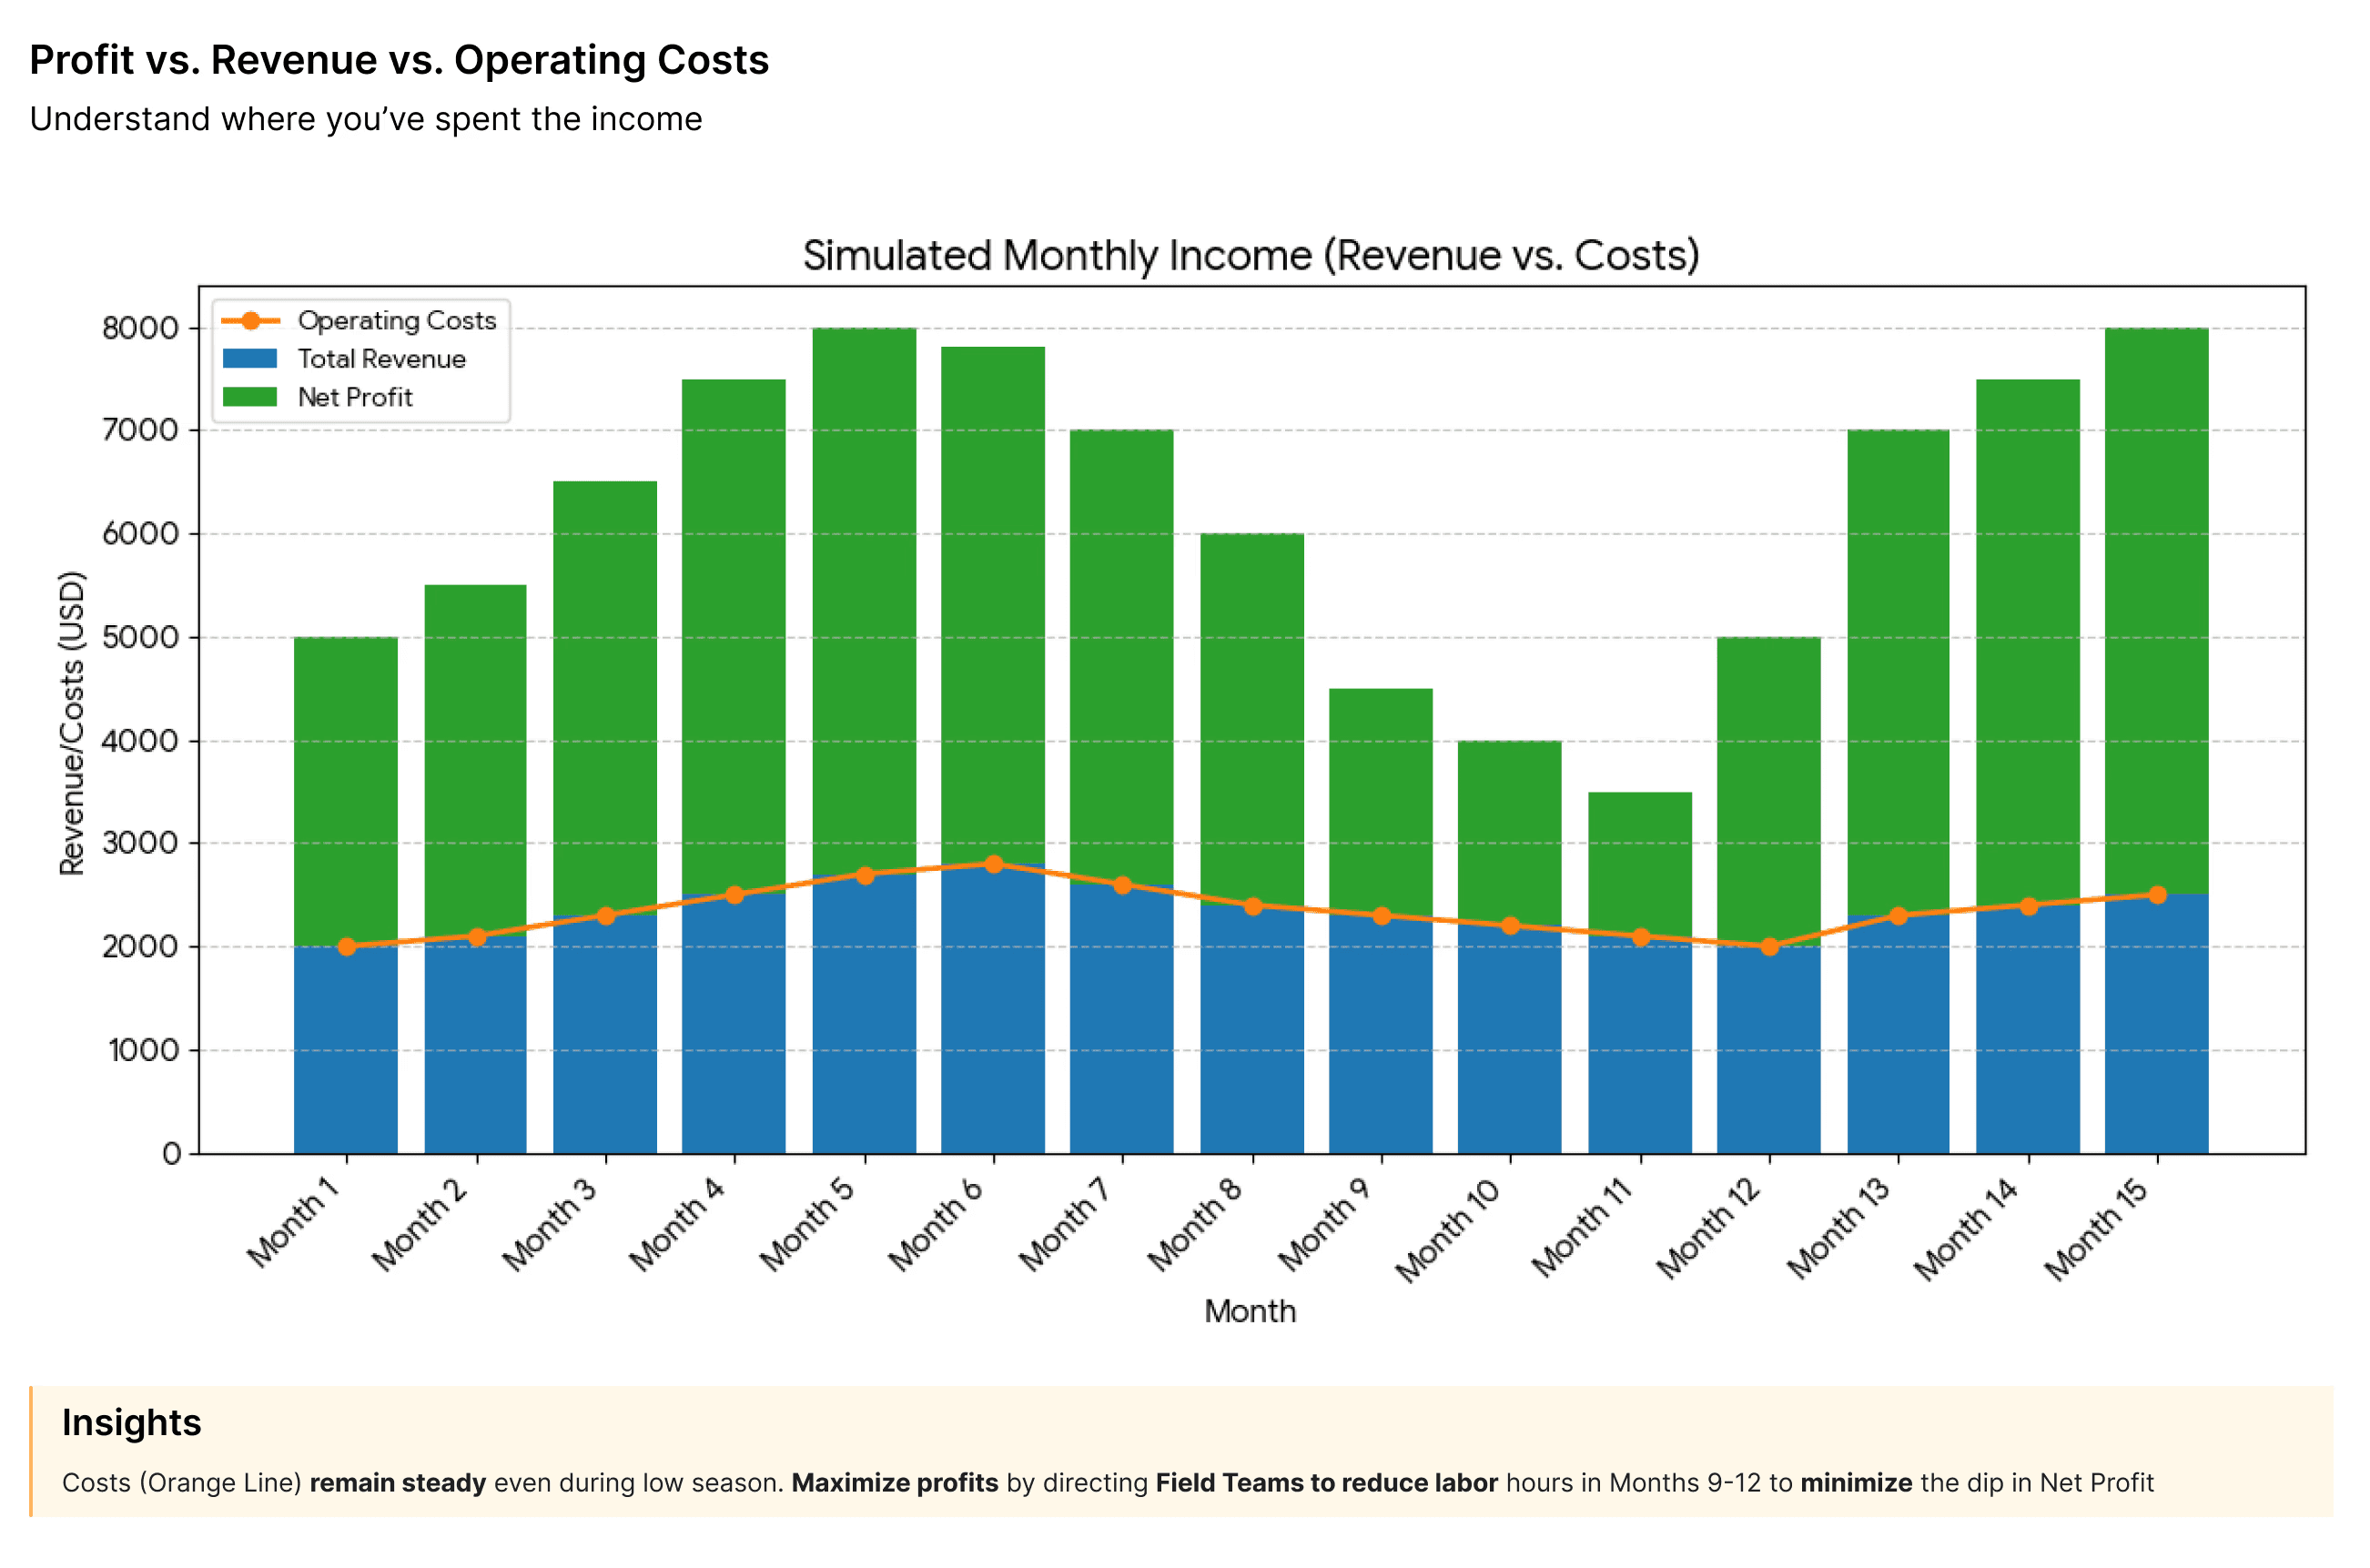
Fig: Revenue page 2
07MVP
Outlining the MVP
I proposed to ship only the initial dashboard — because it focused on fleet management (delivering value immediately) and a bit of financial management.
08Engineering Constraints
Performance as a UX Pillar
Drawing from prior geospatial visualization work, treating speed and snappiness as inseparable from engineering.
Map Stack & Responsiveness
- Proposed using Mapbox with GeoJSON for flexible styling and custom scooter pins.
- Suggested a stale-while-revalidate (SWR) caching strategy so map interactions (pan/zoom, repeated searches) feel instant by serving cached results while refreshing in the background.
Scalability for Large Fleets (10k+ Pins)
- Clustering/aggregation at higher zoom levels, revealing individual pins only when zoomed in.
- Keeping list + map in sync, but not rendering all 10k at once.
- Lazy loading or moving to a dedicated "all scooters" page for full lists.
Prioritizing Critical Data to Reduce Load & Noise
- Surface only scooters needing critical attention (e.g., low battery, repair needed) instead of all devices.
- This lowers backend/UI load and focuses the user on urgent actions, improving both performance and usefulness.
09User Psychology
Managing the "Dip" in UX
- Leveraging the Endowment Effect: By populating the dashboard with a simulated fleet upon sign-up, I create an immediate sense of ownership that motivates users to complete the technician-driven onboarding required to replace "their" demo fleet with live production data.
- Mitigating the "Depressing Zero": To prevent the emotional dip when switching from rich demo data to initially empty real-world data, I proposed locking key metrics or displaying currency symbols alongside specific activation goals (like "Complete your first rental to unlock these metrics") to maintain momentum.
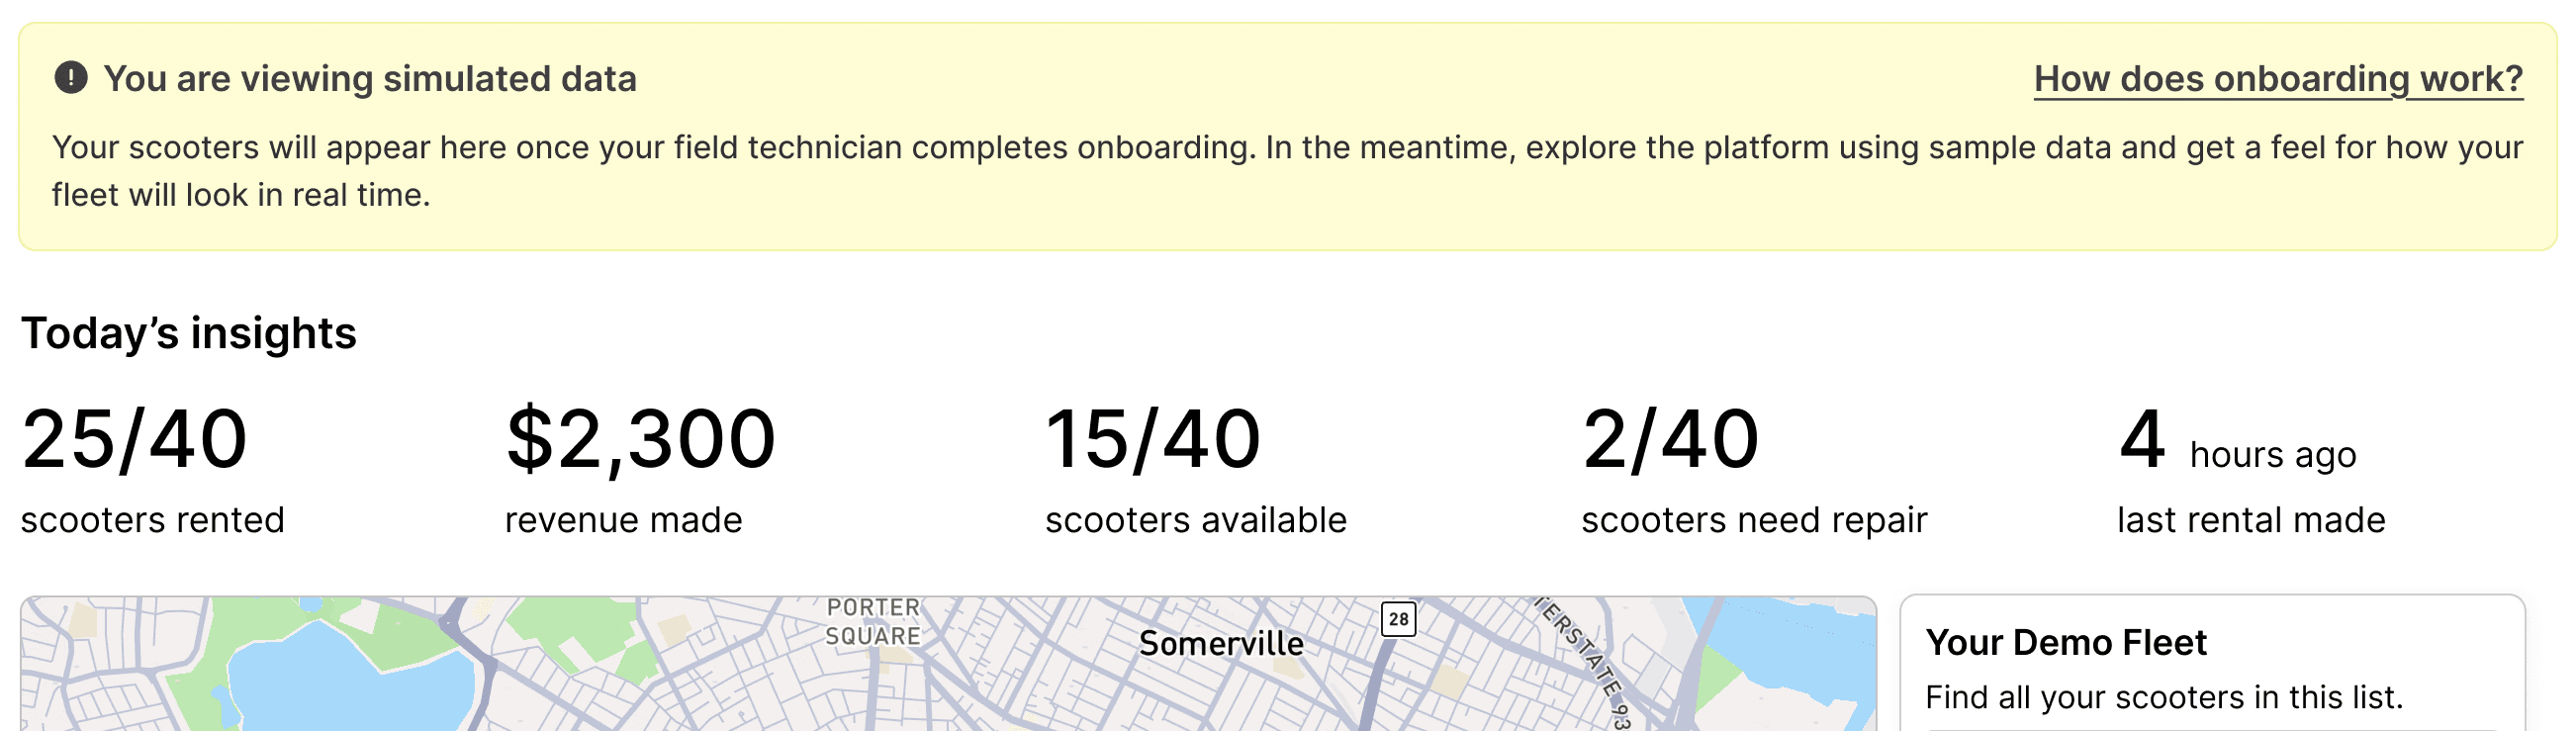
Fig: Endowment effect — they feel they're seeing their fleet

Fig: Preventing the dip when moving from mock data to real data
10Trade-offs
Time vs. Solution
Two critical trade-offs made to protect velocity and focus in a 72-hour window.
- Logic over breadth: I deprioritized individual scooter deep-dives and full repair request workflows to obsess over the "Mock-to-Real" state logic. Proving ROI early is the highest-leverage way to prevent "empty state" abandonment.
- Systemic trust over polished features: I traded a comprehensive revenue management suite for a Provisioning Status Tracker. In an IoT environment, user trust during the 1-2 week technical setup period is more significant than complex financial reporting.
11Testing
How I'd Evaluate the Design
To evaluate the design, I would measure the "Time-to-Value" for users using simulated ROI data versus the original empty state. Additionally, I would load-test the geospatial clustering to ensure the 60fps "snappiness" is maintained when scaling to 10k+ enterprise-level scooters.